DATA meets ART
An art gallery based on data visualizations designed with passion using Tableau and Alteryx.
Thanks to all the Tableau Community for providing such amazing work published on the Tableau Gallery , Tableau’s Iron Viz competition and the initiative of MakeoverMonday.
The first DATA meets ART gallery took place in Luxembourg in July 2019. A fine selection of dashboards were printed on display and accompanied by a large touch screen to provide interaction with the visualizations, bringing data experts as well as novices closer to the technology and profession of data analytics and visualizations.
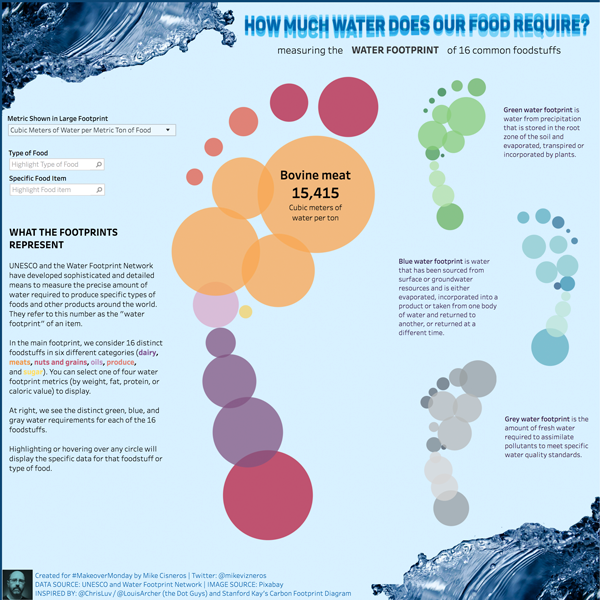
HOW MUCH WATER DOES YOUR FOOD REQUIRE?
How much water our food drinks, courtesy of the Water Footprint Network and UNESCO.
©Mike Cisneros
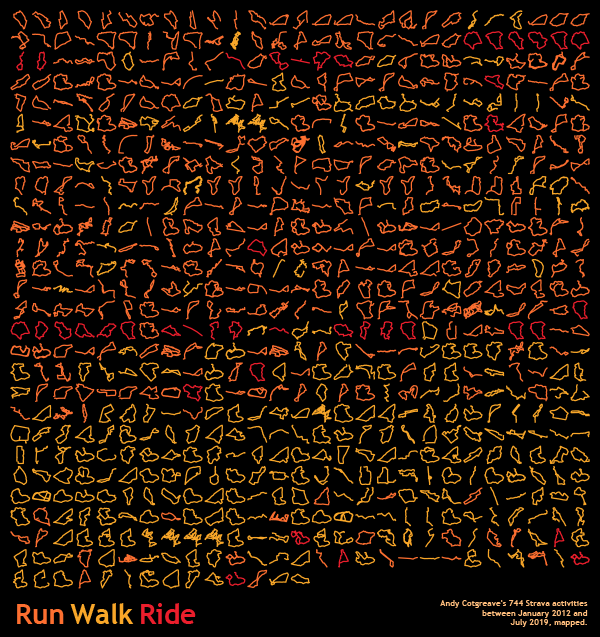
RUN WALK RIDE
Andy Cotgreave’s 744 Strava activities between January 2012 and July 2019, mapped.
©Andy Cotgreave

MY LOCAL ROUTES
Over 7 years I have walked all the paths around my village. This is what that looks like in Strava.
©Andy Cotgreave
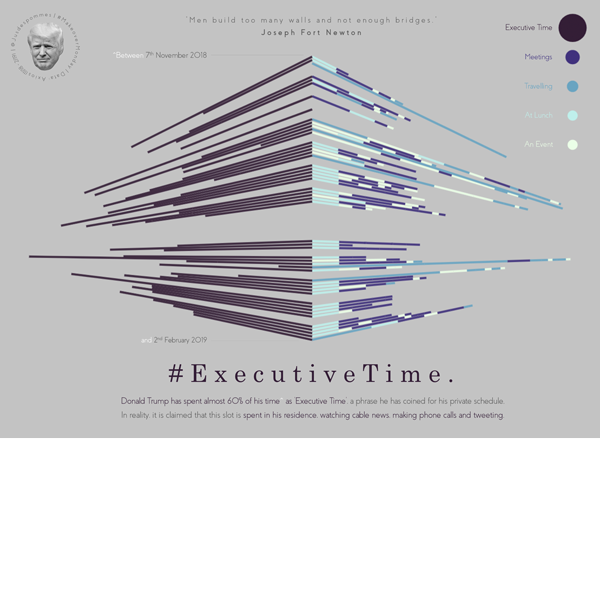
MAKEOVERMONDAY – TRUMP’S ‘EXECUTIVE TIME
Donald trump has spent almost 60% of his time as ”Executive Time”. A phrase he coined for his private schedule.
©Alex Jones
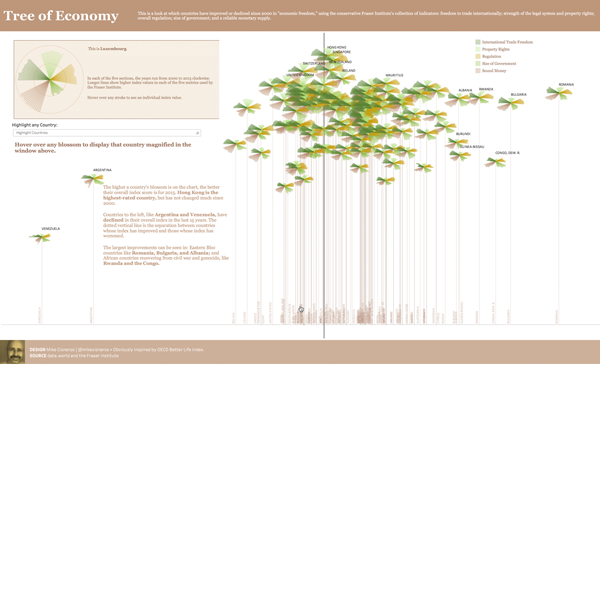
TREE OF ECONOMY
This visualisation looks at which countries have improved or declined since 2000 in “economic freedom,” according to the Fraser Institute.
©Mike Cisneros
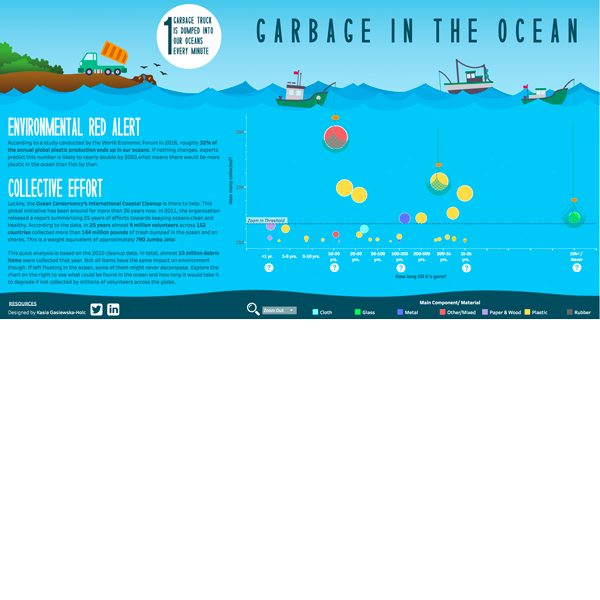
GARBAGE IN THE OCEAN
A quick analysis based on the 2010 data from Ocean Conservancy’s International Coastal Cleanup. In total, almost 10 million debris items were collected that year.
©KasiaGasiewska
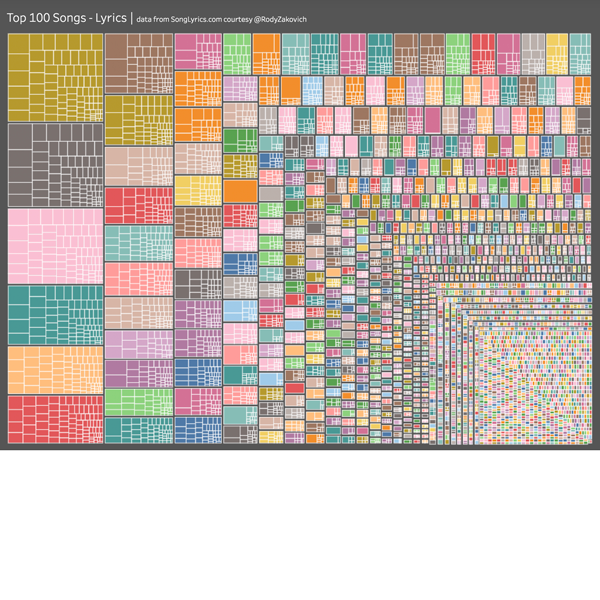
TOP 100 SONGS OF ALL TIME LYRICS
Chris Love visualized all of the song lyrics to the Top 100 songs as a beautiful tree map.
©Chris Love
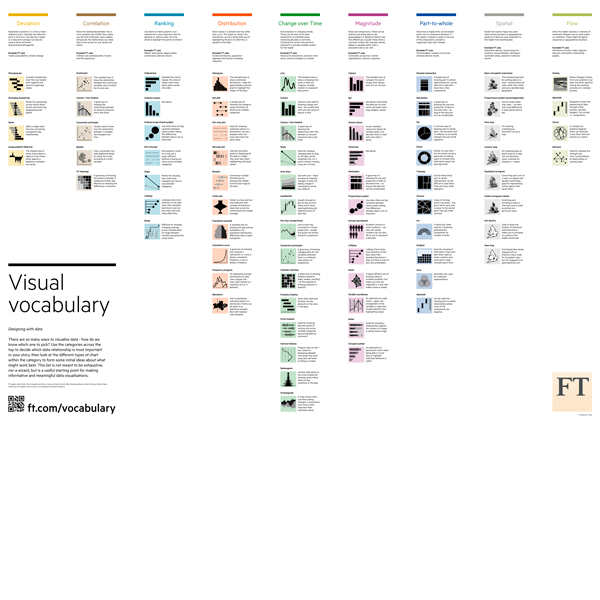
VISUAL VOCABULARY
Andy Kriebel recreates the Financial Times Visual Vocabulary in Tableau. An interactive workbook to assist data analysts to select the optimal symbology for data visualisation.
©Andy Kriebel ©Financial Times
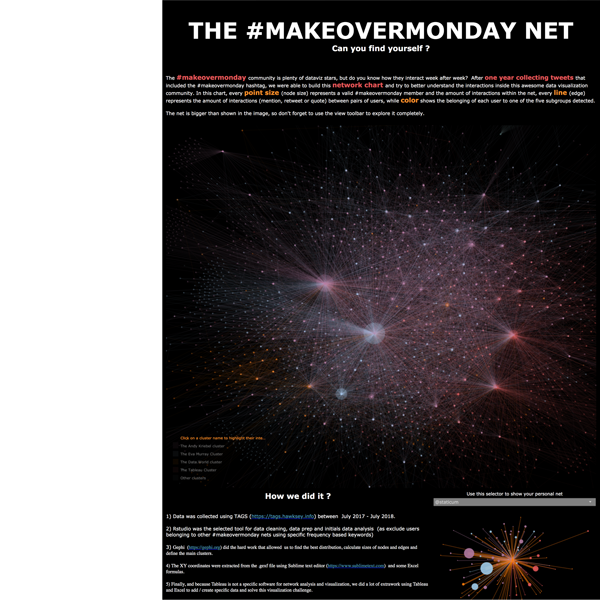
THE #MAKEOVERMONDAY NETWORK
Using twitter tagging data to depict a year in the #MakeoverMondaydata visualization community.
©Sebastián Soto Vera
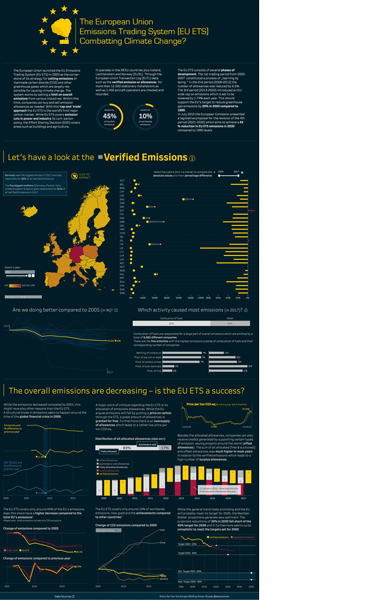
EU ETS: COMBATTING CLIMATE CHANGE?
The European Union launched the EU Emissions Trading System (EU ETS): Combatting Climate Change? Entry for Iron Viz Europe 2019
©Simon Stusak
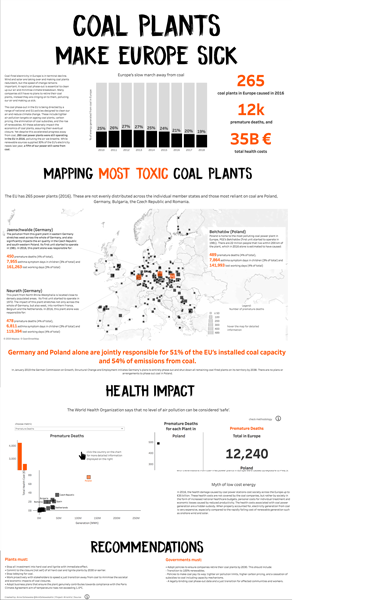
COAL PLANTS MAKE EUROPE SICK
Based on the Report: “Last Gasp The coal companies making Europe sick” (2018). This report is an initiative of the Europe Beyond Coal campaign, under the responsibility of Climate Action Network Europe.
©Anna Dzikowska
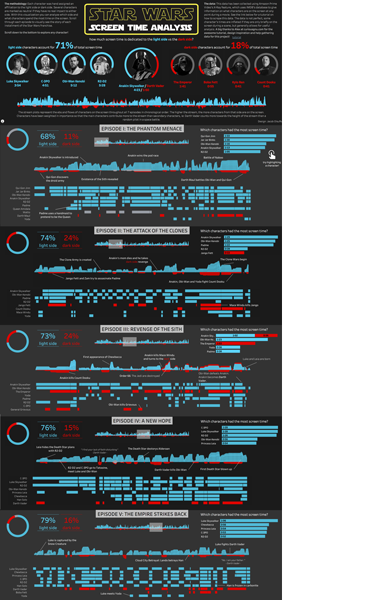
STAR WARS SCREEN TIME ANALYSIS
Jacob Olsufkaanalyzed the screen time of both light and dark side characters in all seven installments of the Star Wars saga.
©Jacob Olsufka
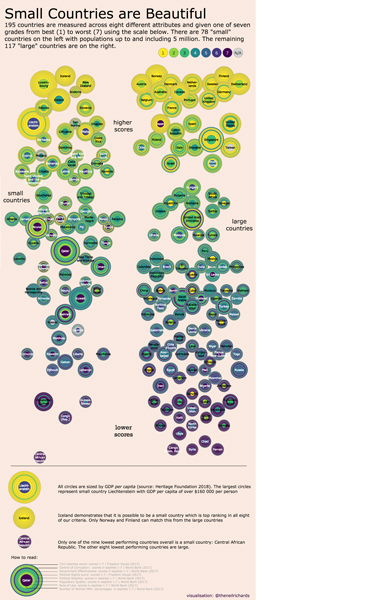
SMALL COUNTRIES ARE BEAUTIFUL
195 countries are measured across eight different attributes and give one in seven grades. The circles are sized by GDP per capita.
©Neil Richards
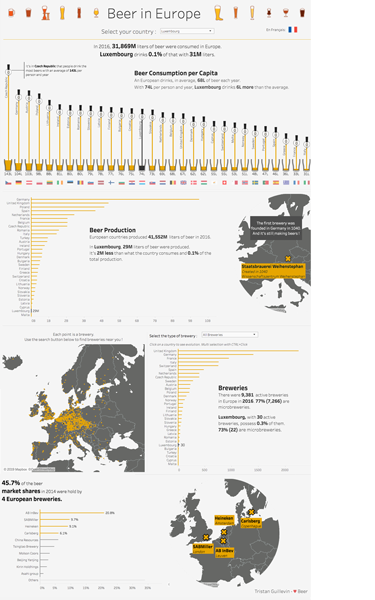
BEER IN EUROPE
Tristan Guillevin explores beer production and consumption in Europe.
©Tristan Guillevin
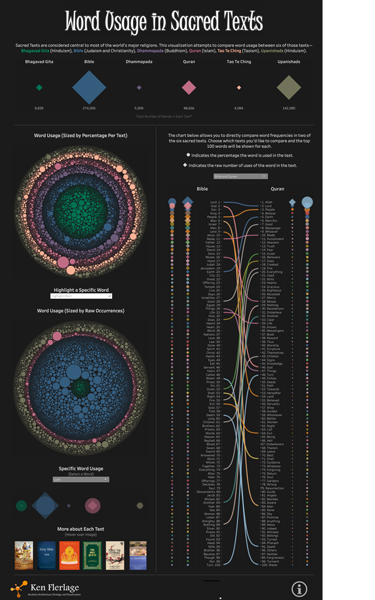
WORD USAGE IN SACRED TEXTS
Ken Flerlage visualizes a comparison of word usage between six sacred texts.
©Ken Flerlage
All work copyright of their respective creators.